5. WEATHER PATTERNS
The weather in the region around the Malaysian Peninsula is dominated by the monsoons. The south-west monsoon begins in May/June and continues to October/November. The north-east monsoon begins in November/December and continues to April/May. There are transitional periods between the monsoons which give variable conditions. The Anambas Islands are best cruised in the south-west monsoon season, when the predominant winds are from the south.
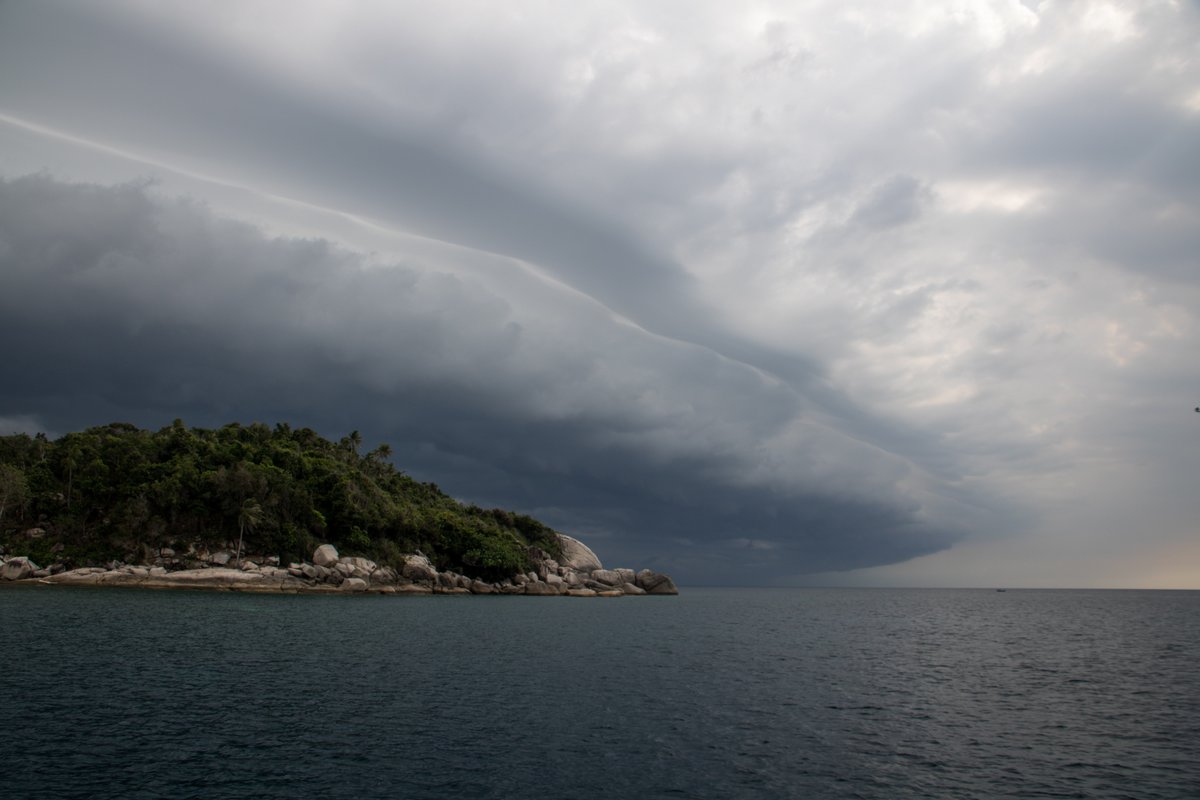
Throughout the year, thunderstorms are common, and sometimes strong. A black squall line might indicate the imminent arrival of a light shower, or sometimes winds of 40 knots or more with spectacular lightning and torrential rain. Fortunately these events are short lived and rarely last more than an hour.
In the two months that we cruised the Anambas Islands (July and August), the weather was very variable although the winds were predominantly from the south. Our first week in July was idyllic with blue skies and 15 knot south-east winds.
For the rest of July and August, the weather was very variable - we had lovely days interspersed by rainy days. The rainy days would start off calm and muggy and then we would see a line of dark clouds approaching from the south west. Within an hour, we would have 30 knot south-west winds and torrential rain for an hour and then the day remained grey and rainy. Interestingly, the pressure seemed to increase by 2mB as the front approached.
While most of the strong winds come from the south-west, occasionally a weather system/squall will pass to the north and with it bring gale force north winds, so make sure that you have enough swinging room and don't "hang" off the north side of a reef.
We had one of these hit us in Pulau Semut South. Dark clouds built to the north and the wind slowly backed to 20 knots from the east. Suddenly the wind backed to the north and minutes later had increased to 35 knots, putting us 30 metres off a lee shore. The gale lasted 30 minutes, then decreased to 20 knots before backing to the west.
If you can get internet access, the Singapore weather radar is useful to show the recent movement of squalls: http://www.weather.gov.sg/weather-rain-area-240km
6. NAVIGATION
6.1 Electronic Charts
We use OpenCPN with CM93 charts and overlays of KAP files that I produce from Google Earth. We also use Navionics charts on our 8” Samsung Tablet and our Raymarine Chart Plotter.
Both the CM93 charts and Navionics charts are very inaccurate in this area, showing very little detail and can be out by up to ½ mile - they are okay for rough planning. (The Navy showed me some photographs of their Indonesian charts which appear to have the same inaccuracies as the Navionics charts.)
Our primary charts are KAP files produced from Google Earth using the GE2KAP utility written by Paul Higgins (http://www.gdayii.ca/). These are very accurate (although some of the satellite images are very low resolution in this area).
I firmly believe that cruising in this area would be impossible without a good set of KAP files or using another way to view Google Earth images off-line. (Our friends on Sea Monkey use Ovitalmap on their iPad, but it is essential to download the images into the application while you have a good wifi connection, before arriving in the Anambas.)
Good sunlight and eyeball navigation is essential practically everywhere.
My KAP files can be downloaded from http://www.thehowarths.net/cruising-information/downloads
A good explanation of how to create KAP files written by Ocelot can be found at:
http://svocelot.com/Cruise_Info/Equipment/KAPFiles.htm
6.2 Tides.
Total Tide has two ports and we found the tidal predictions to be accurate. Navionics and OpenCPN do not have any tidal ports in the Anambas.
I’m not completely sure, but I think that the tidal currents flow south when the tide is ebbing - we certainly experienced this in the channel between Mubur and Matak.


